
Observable – Finding Performance Problems#
With Observable – Remake, you can find out which blocks, machines, entities or automation systems are using a particularly large amount of server performance.
The mod helps you locate the actual causes of lag, instead of rebuilding or removing large bases and machine setups based on guesswork.
Download & Installation#
You can download Observable – Remake here:
CurseForge:
https://www.curseforge.com/minecraft/mc-mods/observable-remake
The mod is made for NeoForge.
Where does the mod go?#
Download the correct .jar file and place it inside the mods folder of your Minecraft instance.
For a normal Minecraft installation, this folder is usually located here:
%appdata%\.minecraft\mods
If you are using a launcher such as CurseForge, Prism Launcher or another modpack launcher, the file needs to be placed inside the mods folder of the corresponding modpack instance.
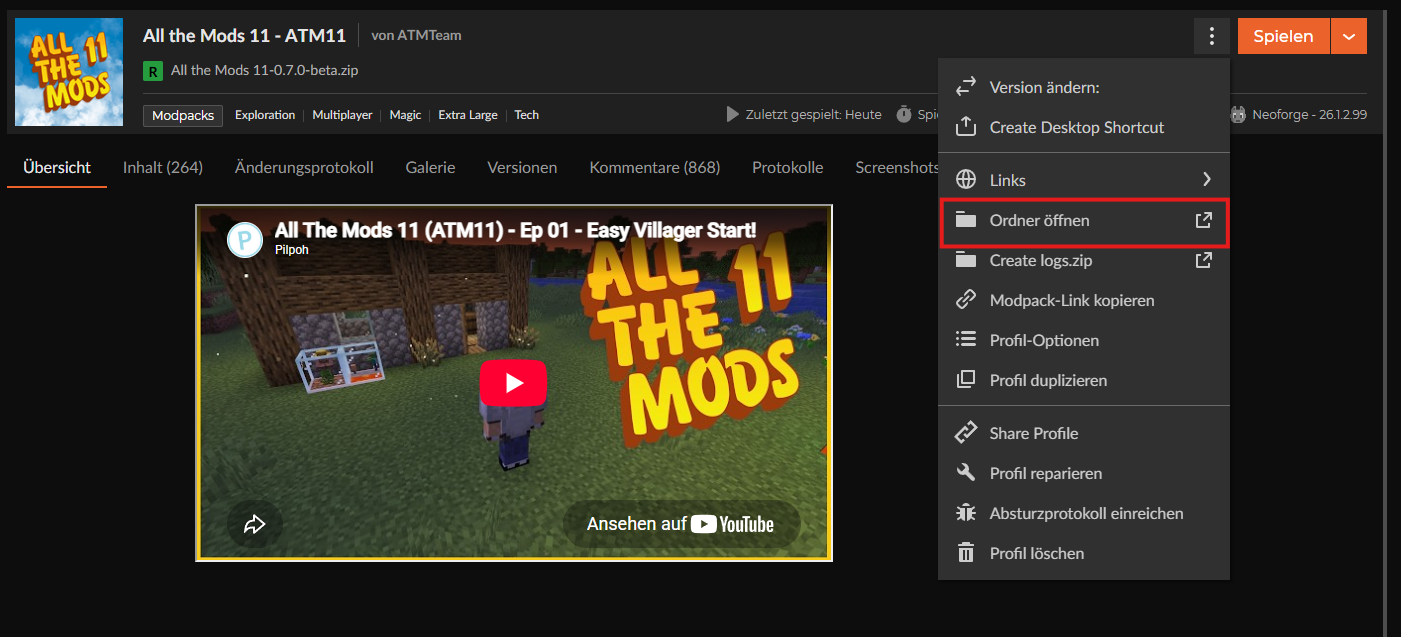
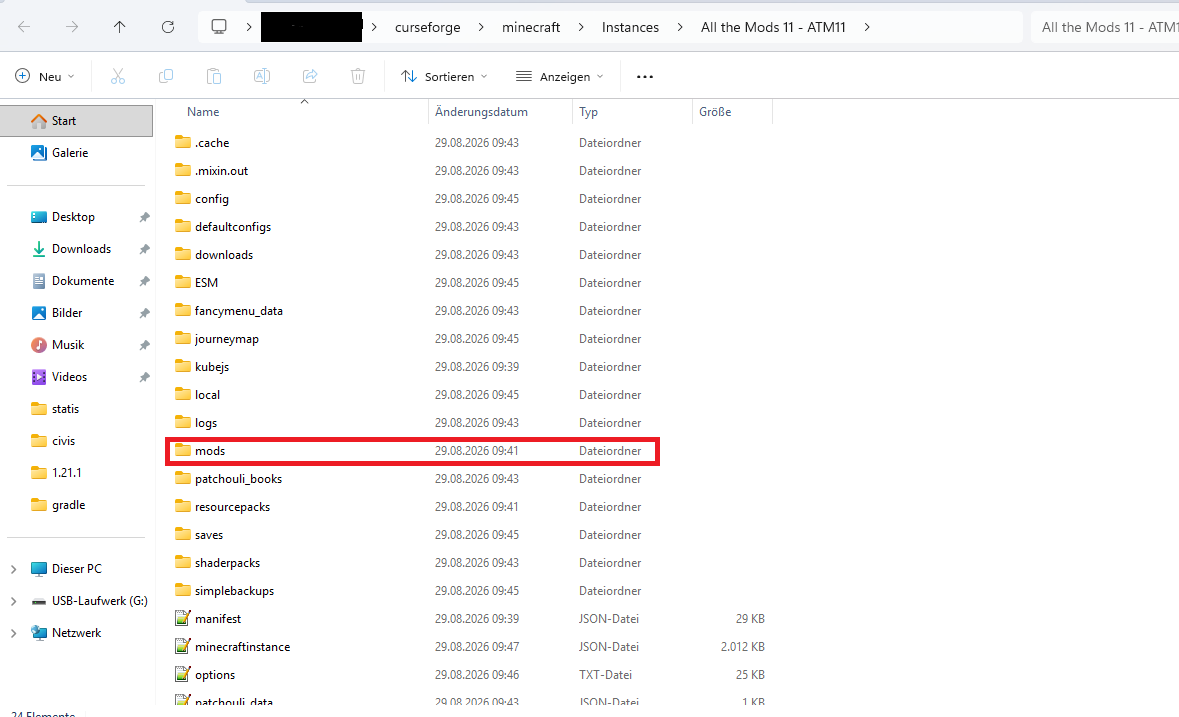
Make sure you download a version that matches your Minecraft and NeoForge version.
What can Observable analyze?#
During a profiling session, Observable records the tick time used by different systems.
Among other things, it can detect:
- Entities
- Block Entities / Machines
- Chunks
- Scheduled Block & Fluid Ticks
- Modded systems and automation
- Applied Energistics 2 networks
- expensive internal processes and execution traces
If Applied Energistics 2 is installed, Observable can also analyze different components and operations inside an ME network.
Opening Observable#
For the graphical user interface and the in-world highlights, Observable also needs to be installed on your client.
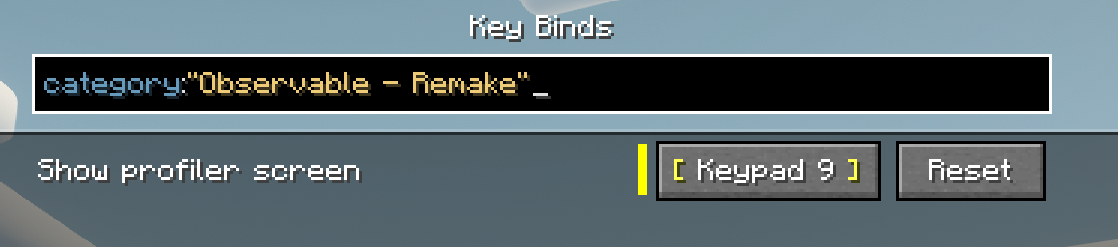
You can find the keybind under:
Options → Controls → Key Binds → Observable
If the key is already assigned to something else, you can simply change it there.
Starting a Profiling Session#
Open the Observable interface and start a new TPS profiling session.
During the measurement, Observable collects information about which areas, machines or entities are using a particularly large amount of server tick time.
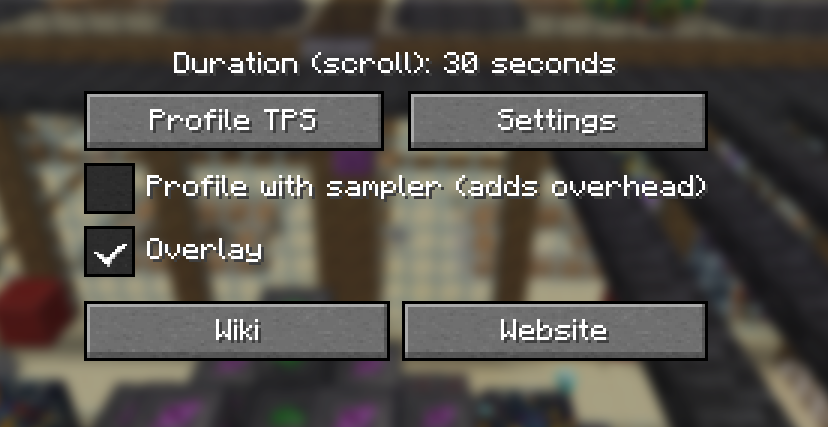
Once the profiling session is finished, the results are evaluated automatically.
In-World Highlights#
After a measurement, Observable can highlight suspicious blocks, machines and entities directly in the world.
Different colors are used:
- 🟢 Green – low or normal load
- 🟠 Orange – increased load and already worth investigating
- 🔴 Red – very high or critical load
What does Red mean?#
A red highlight indicates that an object or system is consuming a particularly large amount of server performance.
For red results, it is worth checking:
- Does the machine really need to run all the time?
- Are there unnecessarily large numbers of the same machine?
- Is a farm still running even though its storage is already full?
- Are large amounts of items or fluids being moved unnecessarily?
- Are there too many entities?
- Can the automation be built more efficiently?
Red does not automatically mean that something has been built incorrectly.
However, it is a strong indication that a large amount of server performance is being used and that unnecessary load may be reducible.
Understanding the Results#
As a general rule:
The higher the measured tick time, the more server performance that object is using.
Observable therefore works similarly to a heatmap.
For example, you can determine whether the load is caused by:
- a specific machine
- a large factory
- a storage system
- many entities
- a farm
- a specific chunk
- or an ME network
This makes it much easier to identify where server performance is actually being used.
What should I do with suspicious machines?#
If you find orange or red areas, you do not need to immediately remove everything.
First try to determine why the machine or system is using so much performance.
Possible improvements include:
- turn machines off when they are not needed
- use Redstone Control
- avoid unnecessary continuous production
- reduce entity counts
- avoid moving items through many inventories unnecessarily
- split very large systems into sensible sections
- avoid unnecessary import/export systems
- only produce items when they are actually needed
Online Analysis#
After a successful profiling session, Observable can automatically upload the generated report.
A link similar to the following will then appear:
https://obs.bombersbude.de/p/PROFILE-ID
You can open the complete report in the Observable Profile Viewer using this link.
The collected data can be analyzed in more detail there.
The link can also be shared with other players or the server team so that the cause of a performance problem can be investigated together.
Tips for a Good Measurement#
For the most useful results:
- investigate a system while it is actively running
- keep farms and machines operating normally during the measurement
- for large bases, investigate individual areas separately if necessary
- pay particular attention to orange and red highlights
- do not judge only a single value; also look for recurring hotspots
- temporarily disable suspicious machines and run another measurement
- compare the results before and after your changes
Quick Summary#
- Download and install Observable
- Place the
.jarfile inside themodsfolder - Open Observable
- Start profiling
- Keep the base or system running normally
- Let the measurement finish
- Check the highlights
- 🟢 Green = normal
- 🟠 Orange = investigate more closely
- 🔴 Red = high load, check for optimization potential
- Make changes if necessary
- Run another measurement and compare the results
- Optionally open the profile link or share it with the server team
This allows you to locate performance problems more precisely and helps keep the server running smoothly, even with larger bases and automation systems.